UPDATE: Nov 18, 2013
Signal: Algorithm still Short, but we are not
Previously, we placed a manual stop loss on the AAPL short signal generated by the algorithm on 11/7 which was triggered earlier this week.
AAPL subsequently tried to break $528 but has since fallen and is currently trading below our ‘line in the sand’ price of $519.57. Our proprietary indicator is still pointing to the downside, and this would be in line with current NASDAQ market sentiment. Aggressive traders may want to short this stock, but for us our appetite for shorting is limited to ‘slam dunk’ shorts of stocks that are at all time highs, which APPL is not. We will not trade this stock again until the algorithm goes long. For now, if there is further weakness this week, we may add this as a short to our public blog.
UPDATE: Nov 15, 2013
Signal: TRADE CLOSED
The stop loss of $525 was hit on the AAPL short position for a loss of -1.05%. The algorithm is still indicating further downside, but the risk/reward at this point is not appetizing enough to stay with the trade.
UPDATE: Nov 12, 2013
Signal: SHORT
The Algorithm is still short AAPL from 11/7 at $519.87 with a stop at $525. AAPL is still in an up trend from April this year, however its correlation to GLD is still in tact, and GLD is down significantly this week.
AAPL’s price is hovering near the top of a trend channel developed over the past 6 months which it has touched 3 times already. If the stock were to break down, this would be a good area for it to do so.
We continue to maintain the signal and stop level, however the underlying bullish stories are still plenty and it could take some time for the trade to pan out. If the stock does not close below our entry price of $519.87 by end of day this Friday Nov 15, we will either tighten (lower) the stop price, or exit the trade entirely, depending on what we see in the charts. In the mean time, shorting any stock is a high risk proposition, and we recommend using Options to express a trade to the down side while limiting capital risk.
The Algorithm has been right the past 2 trades on AAPL, and even if this trade should be stopped out at $525, it is likely that the next BUY signal would properly time any upside swings. As always, notifications will be sent via email if and when this occurs.
Click image to enlarge
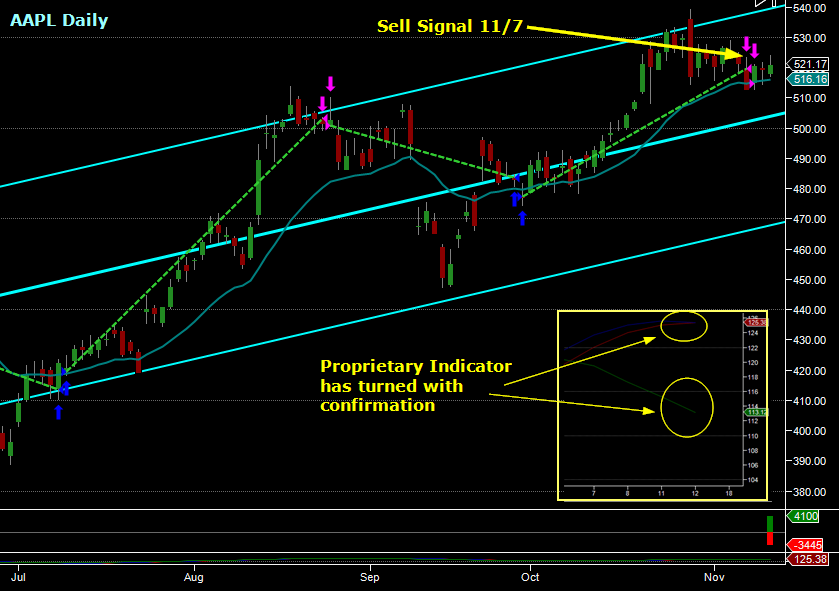
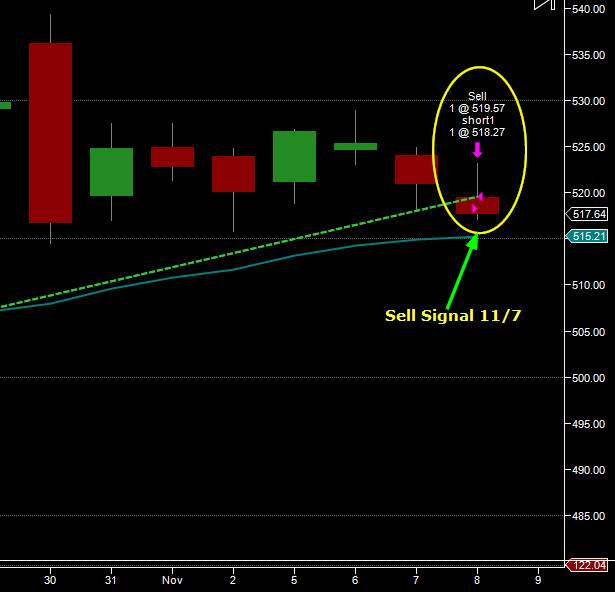
UPDATE: Nov 7, 2013
Signal: SHORT
The algorithm went short today at $519.57. If shorting the stock we suggest placing stops at $525.
Related articles that support position:
http://news.investors.com/110813-678556-apple-iphone-buyers-already-own-iphones.htm?ven=yahoocp&src=aurlled&ven=yahoo
http://seekingalpha.com/article/1824562-insiders-are-selling-apple?source=yahoo
—
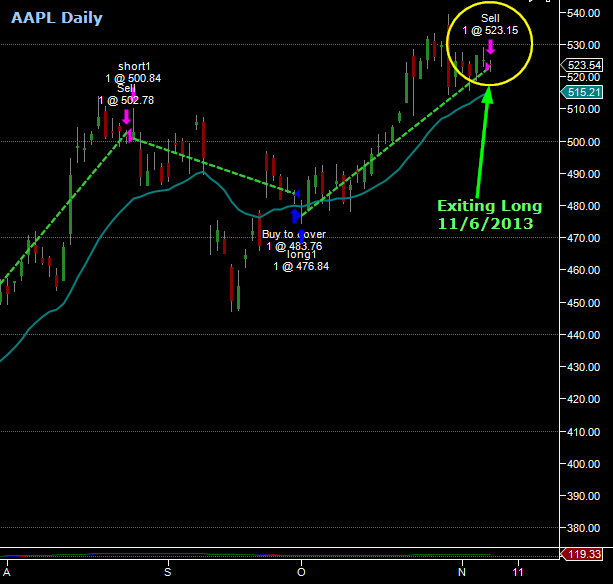
UPDATE: Nov 6, 2013
Click image to enlarge
Signal: EXIT LONG (flat)
The algorithm exited the long position from 10/1 at the open today, 11/6, for a fill price of $523 and an overall gain of 9.31% on the trade. The algorithm is now flat (no positions) on AAPL. The algo could potentially give another buy signal at a lower price, or the next signal could be a sell, but this will depend on the the market patterns and price action in the next few days. Only time will tell, and we will alert subscribers as soon as this happens.
—-
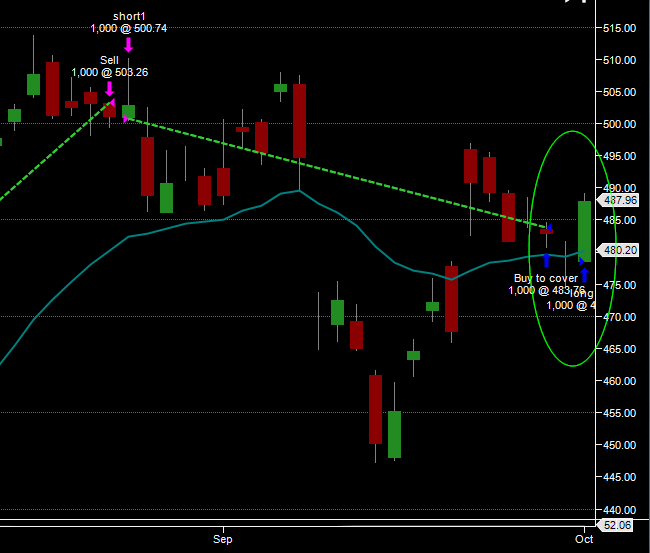
Oct 1, 2013
Symbol: AAPL (NASDAQ)
Signal: LONG
New LONG signal on AAPL, which has a strong positive correlation to GLD which we are also bullish on. The stock has recently had an upgrade from BMO. Trading pattern goes back to 3/09/13.
Related analysis supporting position:
http://wallstcheatsheet.com/stocks/analyst-fewer-iphone-sales-but-higher-margins.html/
Click image to enlarge