Facebook (NASDAQ:FB)

The Algorithm which gave us combined 5% return in 8 weeks on Facebook stock just generated a short signal, and the proprietary indicator is showing that there could be a healthy correction ahead.  We never like going short as this is the most inefficient path to profitability, however in sideways market conditions we take what the market offers.

This has been added to the high risk/reward portfolio, and the fill price will be Monday’s opening price (regular trading hours).

Rather than shorting the stock outright we prefer to sell June 13 62 calls currently trading around $1.20.  The trade is a winner if Facebook fails to close above $63.20 by end of day Friday.

The Summer Doldrums have officially started

Summary:
  • S&P 500 shows strong upward momentum.
  • Expect sideways trading action with occasional up/down extremes from now until September.
  • Come Fall, expect news out of Asia and EMEA to give markets a downward Jolt.
  • Have you ever noticed that the largest market-moving news headlines happen between September and May? Russia/Ukraine, Abenomics, the European crisis of 2012… it is no coincidence that news with the greatest impact occurrs outside of Summer vacation season.

    Market trends happen based on large capital flows, but capital only flows when the keepers of that capital are engaged. In the Summer, investors, politicians, and military leaders are more concerned with planning family vacations, enjoying the weather, and locking in gains they earned over the winter months. Even the President of the United States is on a working vacation this summer touring Europe with his family.

    With fewer players at the poker table what we end up with is a wild game of 5 card stud that produce swings and sideways trading which can last for months.. at least until the kids are back at school.

    Continue reading

Trade Review (Facebook) & Outlook – April 30, 2014

Dear Subscribers,

Here we are, 67 days into 2014, and the S&P 500 has risen a measly 36 points.  And in that time, the index has also had a 161 point swing from the bottom in January to the top at the start of this month.  Investors dislike volatility, and when markets become turbulent, investment capital makes its way to the exits… that is, at least until markets can prove themselves.

We continue to maintain our hypothesis from the start of the year.   In ‘What to expect in 2014‘ we stated:

In our view, the (really) easy money is over.  2013 was the year to front-run this massive shift into U.S. equities, and the market responded in spades.  You could have thrown darts at an index of stocks and done quite well (unless you were a hedge fund).  But after a 30% return in 2013, what does the market do for an encore?

If the S&P were to rise another 30% this year not only would this be a miracle, but P/E multiples would be at dangerous nosebleed levels and we’d all be in trouble.   A more reasonable 10% gain this year would get us to 2,000 on the index – a nice round number, and an area many analysts are calling for.

To achieve a return of any more than that in 2014 will require a little more discriminate stock picking, and that’s where our algorithmic research comes into play.

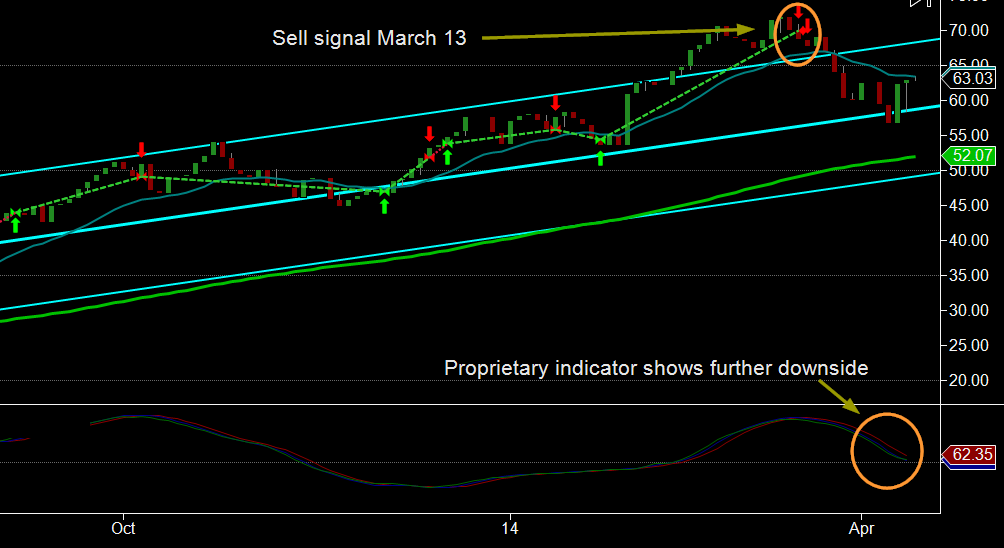
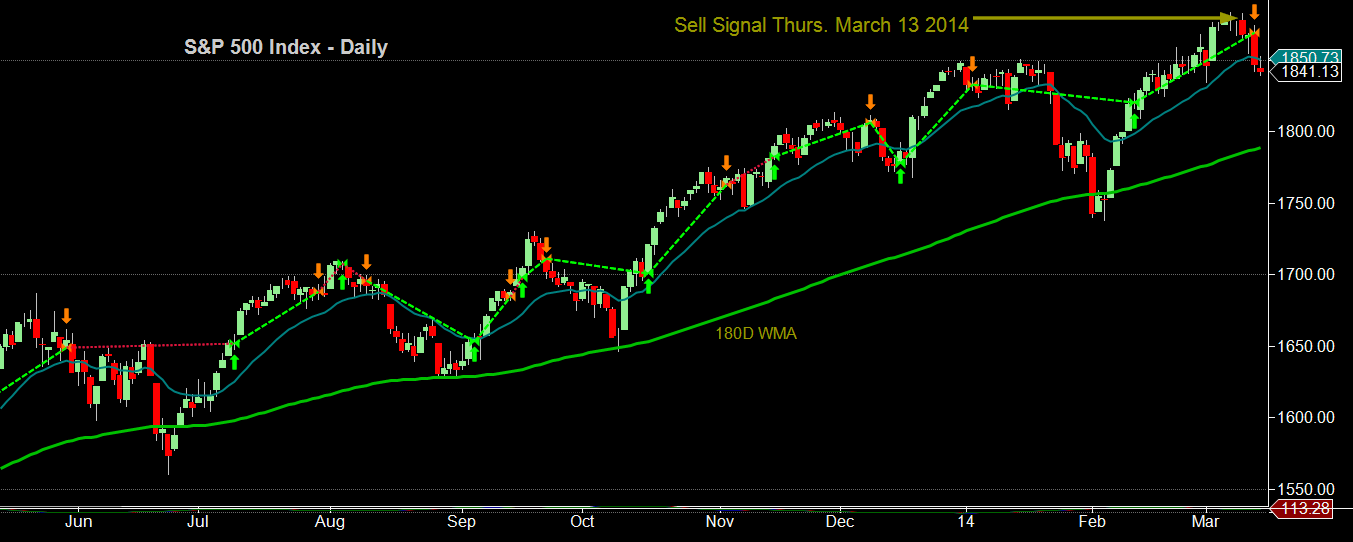
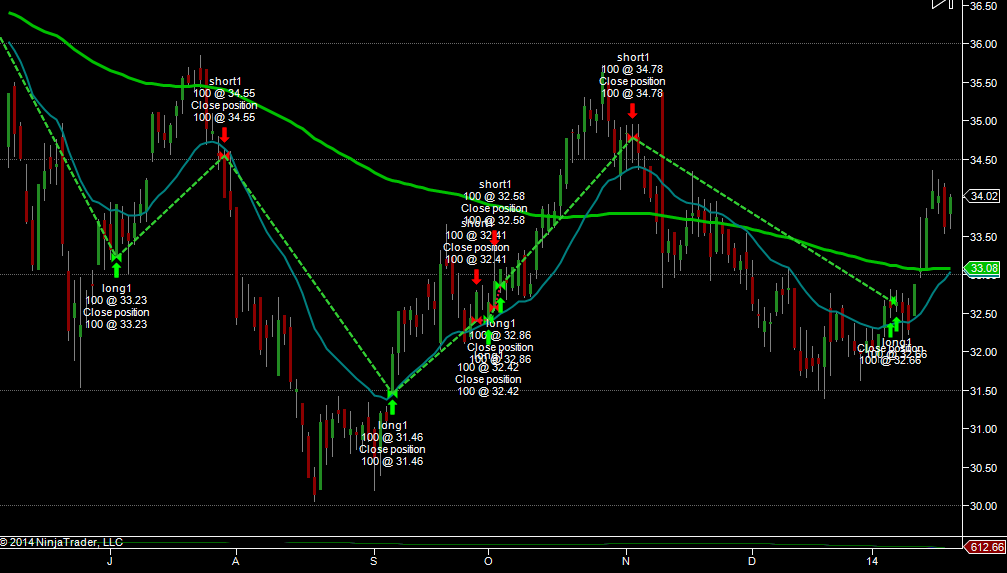
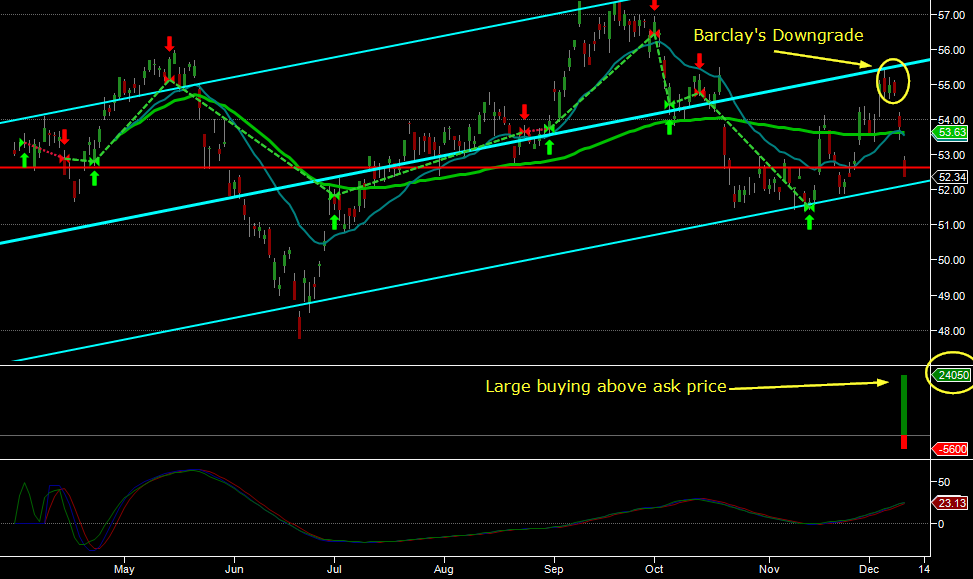
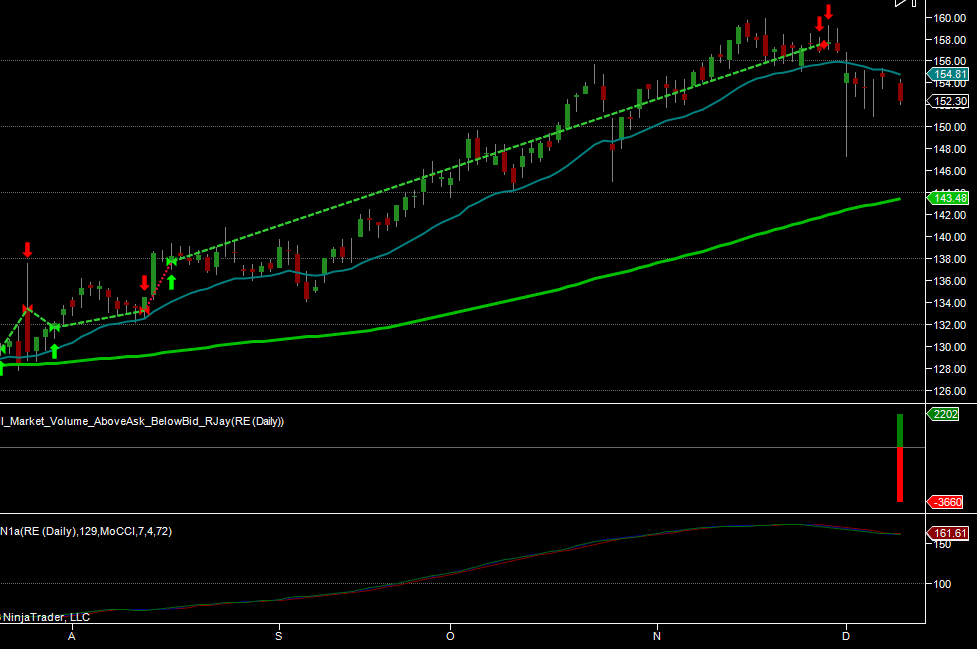
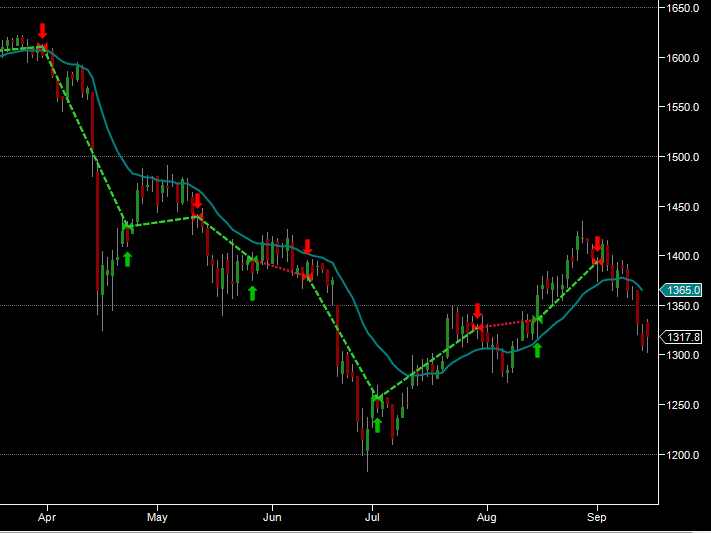
To wit, on March 13 we warned against taking new long positions – the reason being because our algorithms identified a 2 year profitable trading pattern that finally broke down:

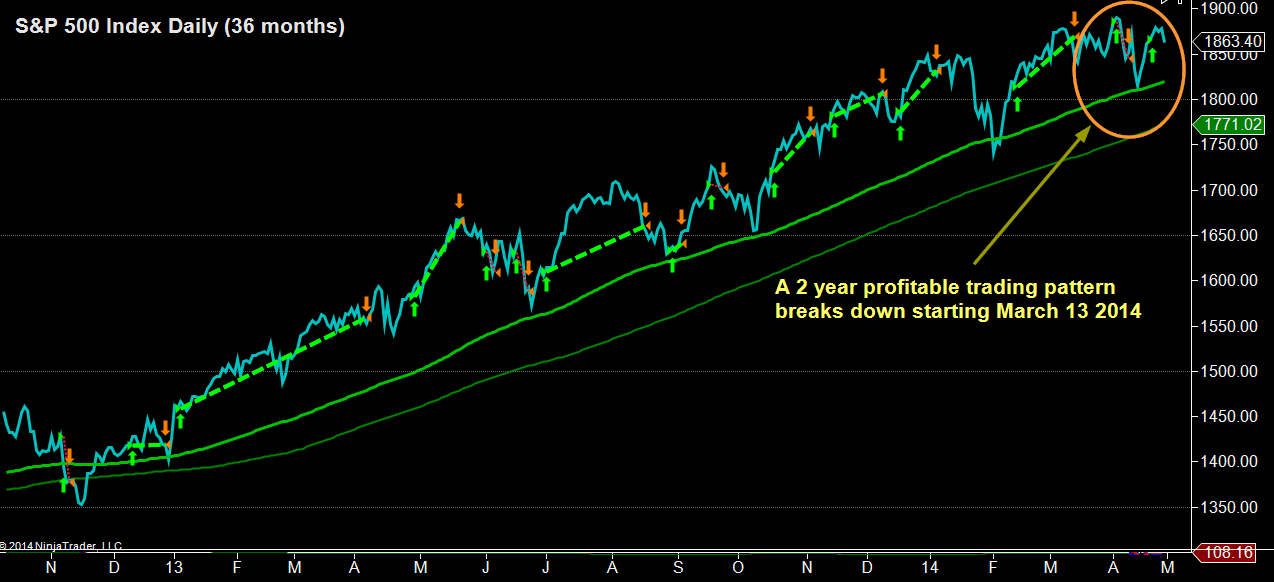
From a quantitative perspective, when cycles break down, the #1 rule in algorithmic trading is to reduce positions or exit entirely, thus contributing the volatility.   In the 5 weeks that followed our warning, markets have moved sideways confounding longs and shorts alike.

Clearly, Global Markets are undecided as to the direction of the next move.  Today, investors sought clues in the FOMC minutes released at 2:00pm, but  they saw nothing that would warrant breakout of the current sideways movement, and so here we are stuck between 1850 and 1880… for now.

We care about the direction of the S&P 500 because, theoretically, this is an all encompassing barometer of risk trends – not only within the US, but world wide.

Since our March 13th warning the S&P 500 gained a mere 1%, where our core subscriber portfolio gained 10%, which puts our monthly gains in the median range of the best performing hedge funds of all of 2014.

While many are staying on the side lines waiting for markets to resolve themselves, we have taken some trades which have a relatively high probability based on some shorter-term trends we have been witnessing (see our past posts) combined with our quantitative algorithmic signals:

March 14: ConAgra Foods:  4%
March 24: Cliff’s Natural Resources: 4%
March 24: Mosaic: 2.2%
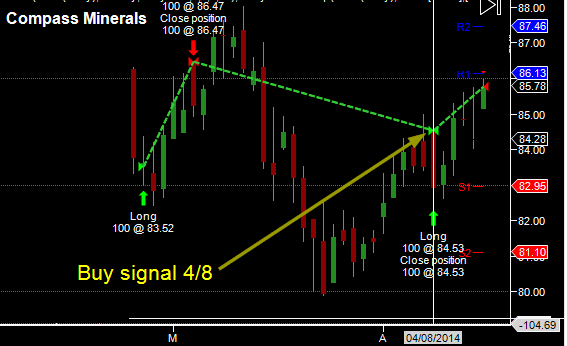
April 15:  Compass Minerals: 7%

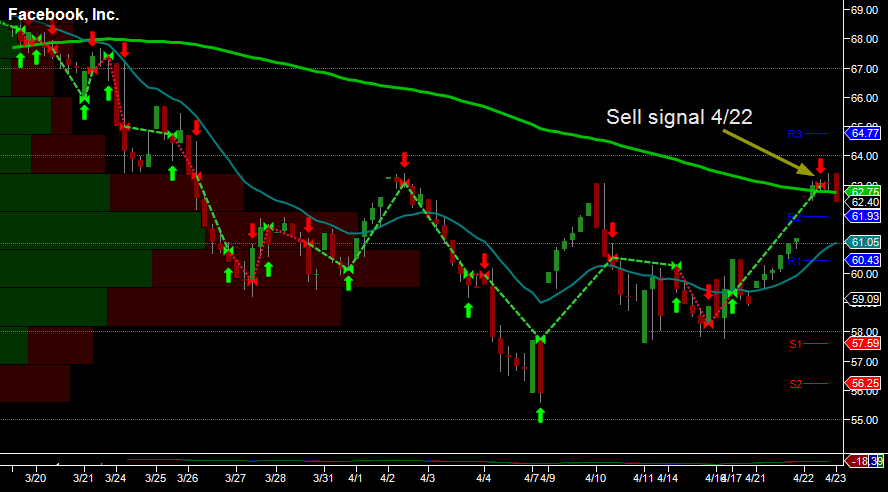
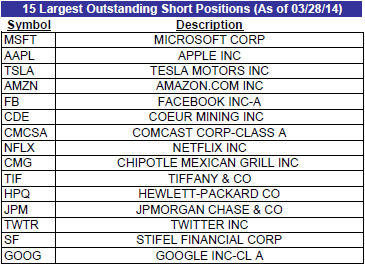
In the High Reward/Risk portfolio, CCIH gained 16% before trading below our entry point by 8% – a testament to current market volatility, especially in Chinese names.  Our 2 short Facebook trades (capitalizing on momentum selling) returned 1.7% and 1.3% respectively.

In our post 2 Trades to capture interim capital shifts, we called for a down turn in both Oil and Oil stocks, and a down turn we did get.  Oil subsequently dropped to below $100, and both XOM and CVX did have a move down, but the down move was short lived as share buy backs were announce to levitate their respective stock prices.

Going forward we continue to follow the line of our three core themes:

1.  Inflation due to global quantitative easing by central banks on a global scale.
2.  A range-bound US equity market.
3.  A slow, grinding upwardly mobile interest rate environment.

We have also started tracking additional side themes that have materialized, namely:

1. A slow-down in advertising spending
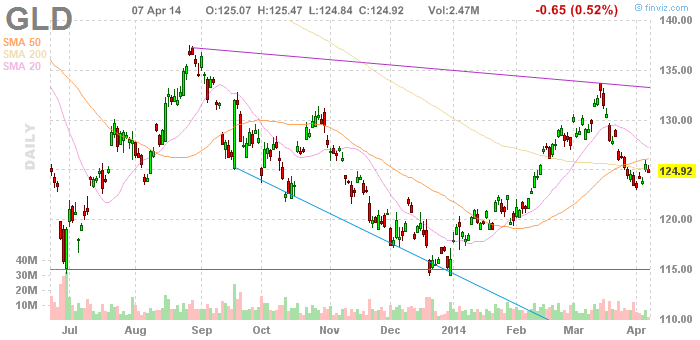
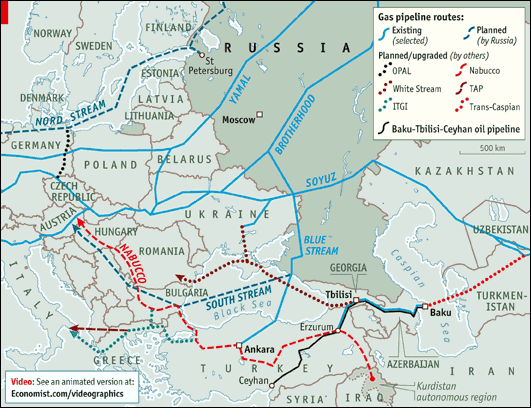
2. Capital flows into independent oil/gas companies.
3. Capital flows out of stocks with high valuations.

On a more positive note, the side ways motion we are seeing in the S&P 500 is good.  As we stated in January:  “What we hope for is a healthy correction.  What we may end up with is a huge short squeeze.

Markets are definitely on the verge of a break out, and which direction they break still remains to be seen.

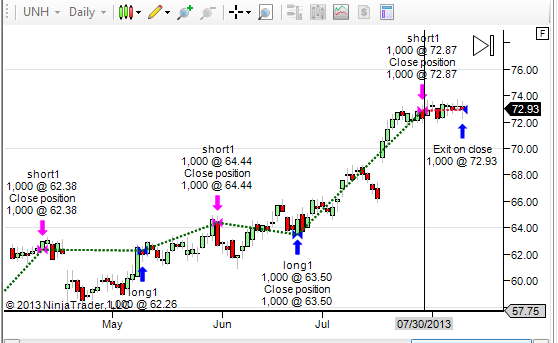
Current Facebook Long Trade:

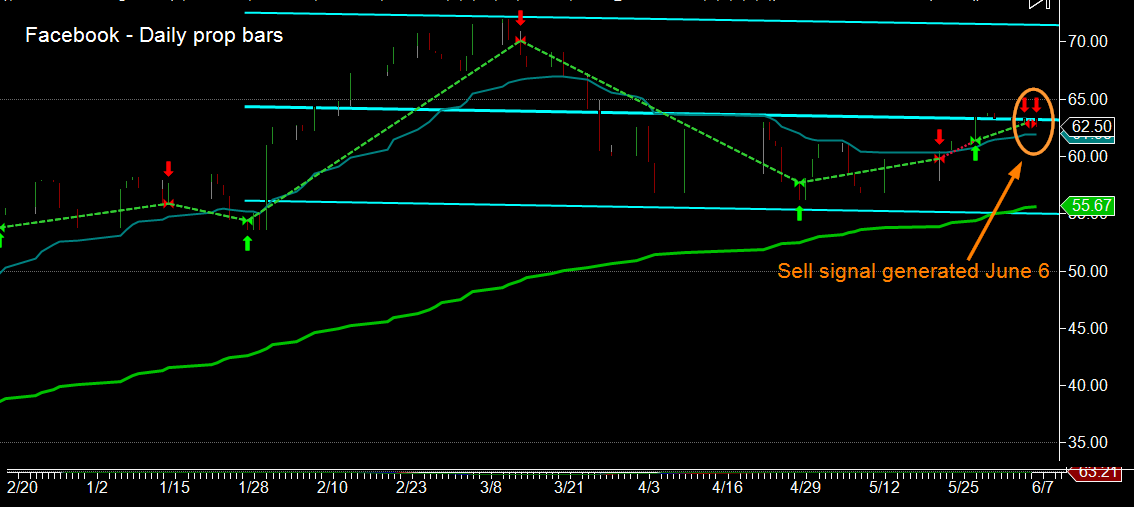
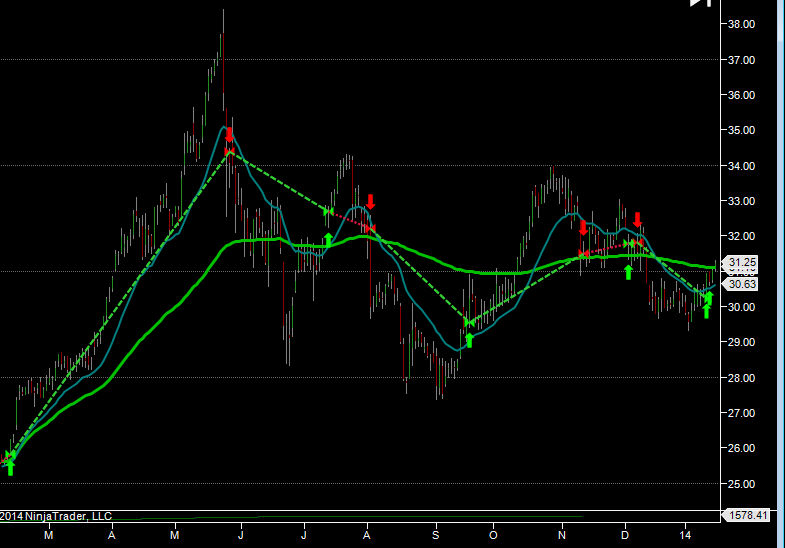
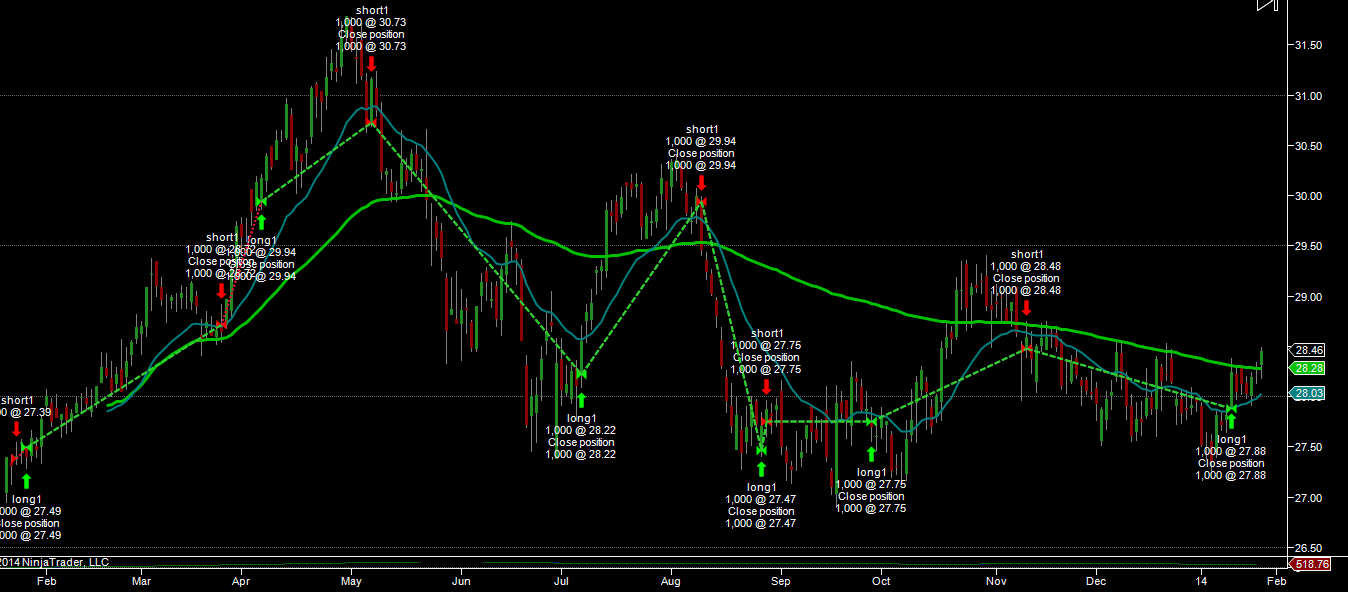
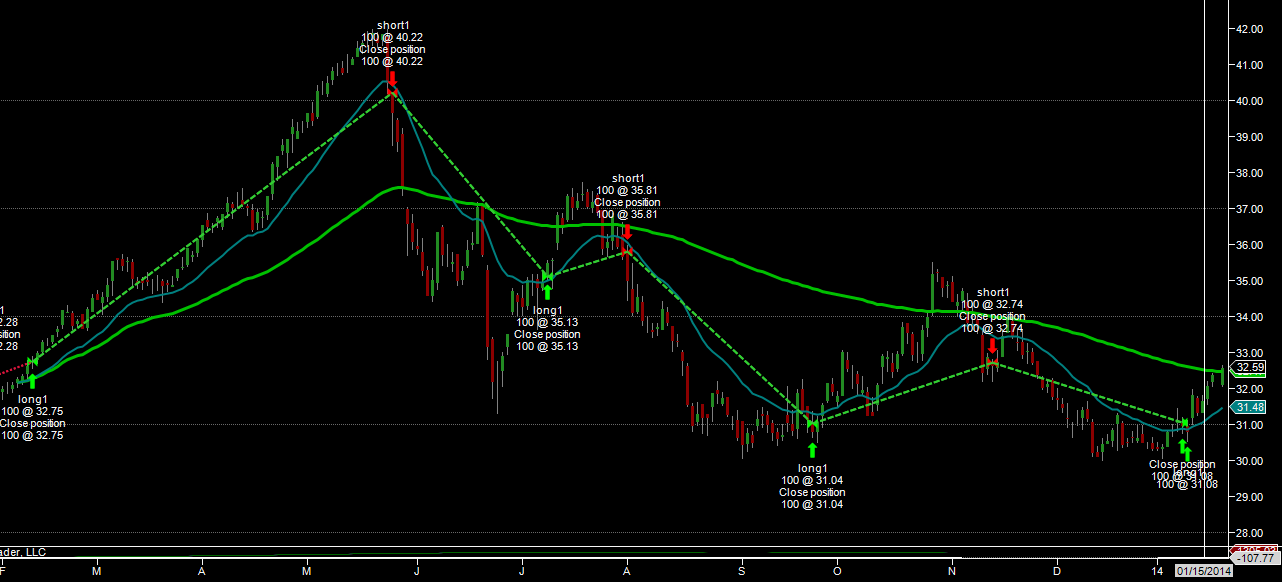
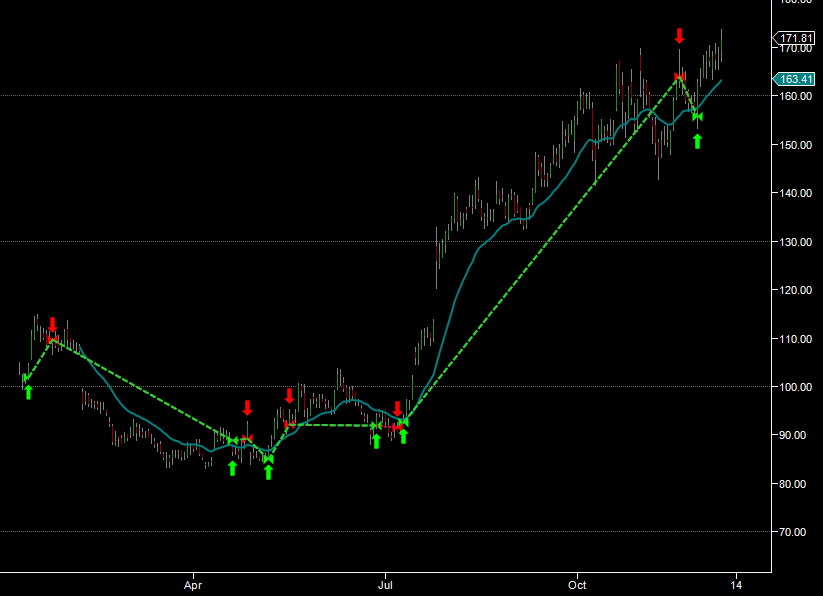
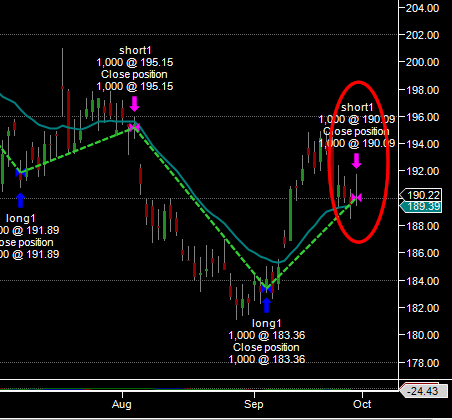
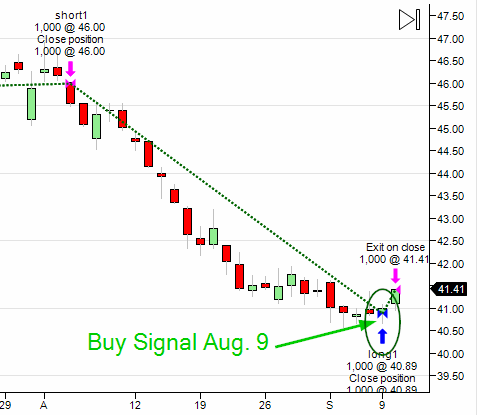
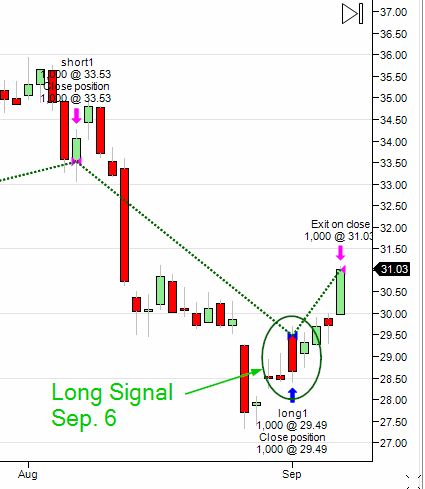
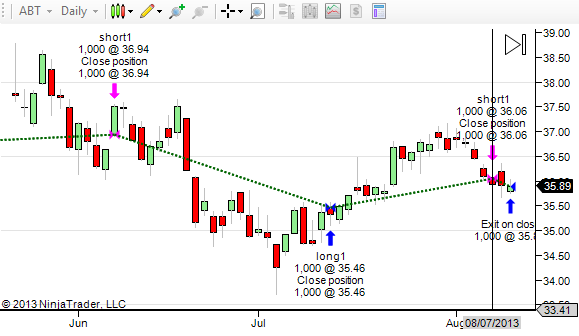
Today we alerted to a Buy signal on Facebook (NASDAQ:FB) – this is in line with a profitable trading pattern going back to the company’s IPO in 2012 and is the same pattern which generated the Sell signals last week for a quick 3% gain in 2 days.

As of today, that algorithm has switched to Long, and we are quite confident as to the strength of the historical pattern.  In fact, since our signal at 58.50, Facebook spiked to $60.40 after hours for a 1.5% gain, and we expect further upside.

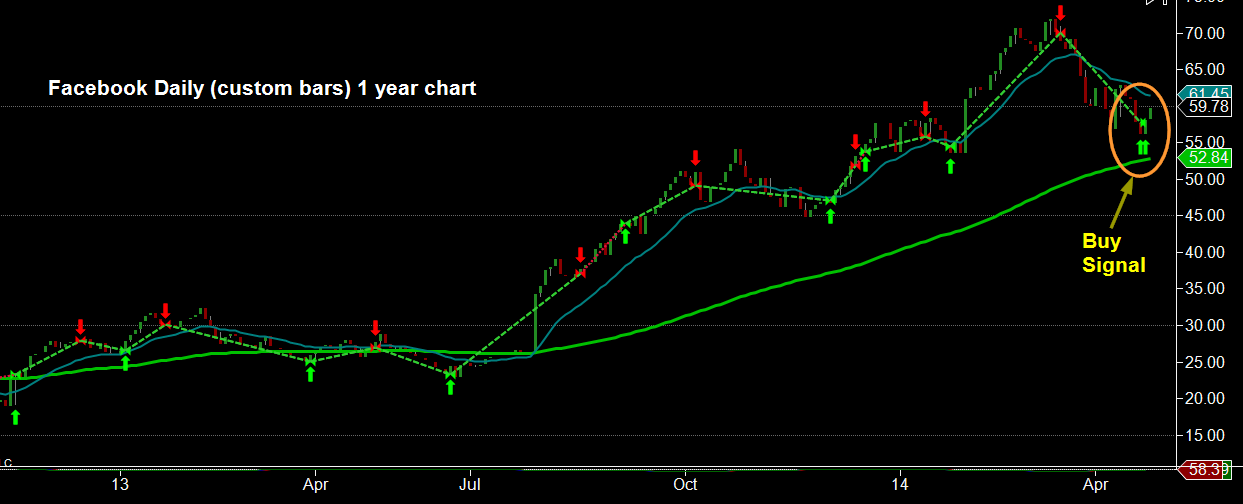
Long-term Facebook patterns continue to be profitable (click to enlarge)

Facebook (NASDAQ:FB)

Update 3: April 24, 2014 – Trade Closed 62.20 AH (1.27% Gain)

Facebook again beat on earnings estimates, but given the recent numbers it is apparent that their growth is slowing.  For example, European users increased last quarter, but European revenues decreased in the same time period.  Those in the know likely anticipated this which is why the stock sold off from previous $70 highs.  In after-hours trading last night the stock traded in a $10 range from $55 to $65 and our 62.20 stop (profit taker) was hit.  FB is currently trading at $64.45 in pre-market.   At least covering analysts downgraded the stock this morning, so some volatility is expected.  We will continue to watch the algorithms and may alert to another entry based on the strong historical patterns we are seeing.

Update 2:  April 23, 2014

Facebook is currently down 2% from the Sell signal yesterday.  The stock is now trading at thin volumes in anticipation of the conference call this evening.  The short trade is still Open and we do expect further downside, however we have applied stop loss order (profit taker) to be triggered after market hours with a trigger price of  $62.20 – this is due to the extreme after-hours trading volatility we have seen on past conference calls.    If your broker does not allow after hours trades, it is advisable to exit the trade now.

Further commentary to follow after the call.

April 22, 2014 – Short FB

NOTE: FB EARNINGS CONFERENCE CALL AFTER CLOSE TODAY – HIGH RISK TRADE – READ BELOW

In our quantitative analysis we seek liquid stocks with clean historical trading patterns which can be extrapolated to predict the next move.  For some time, Facebook was one of those stocks, and it was predictable enough for us to launch the Facebook Stock Predictor.  After awhile, those patterns shifted as the stock became subject to some High Frequency Trading shenanigans.  Recently however we have discovered a different long term trading pattern which continues to be in place today which indicates that the trend should continue to be down.

FB Daily custom bars – click to enlarge

Yesterday’s signal game on a second algorithm running on a shorter 60 minute time frame, when it triggered the Sell right near the $63 level.

Yesterday Facebook closed at $63.  After the close we Tweeted “HFTs should run this up to 64 pre-market tomorrow” – and run it up they did, but $63.80 is all they could muster before FB tanked at the open this morning (currently at $62.21).

Manipulation by HFT algorithms is not a bad thing when you can predict it and use it to your advantage, such as like we did with Facebook.

NOTE:  Facebook’s earnings conference call is after the close today.  For the past 4 FB earnings releases, if the stock traded down on the day of earnings, the earnings impressed with the stock trading higher the next day.     If by 3:30 PM today it appears that Facebook will close down, we will likely exit this trade.  Stay tuned for the alert.

We do consider this a High Reward/Risk trade, so it is currently being tracked in the appropriate portfolio.

Largest Oustanding Short Positions indicate more pain for Momentum Stocks (IB)

Interactive Brokers – popular among the ‘smart money’ crowd – released the top 15 outstanding short positions of their customer as of April 17.

Again the Momentum names appear on this list from last week: Tesla, Amazon, Google, Netflix, Yelp… most which have seen some heavy price drops this past week.

A new notable entry on the list:  Coeur d’Alene Mining (NYSE: CDM) :  This stock is 50% off its 52 week high of $17/share and is trading at a new low of $8.43.   When this many short sellers appear on a beaten down stock with negative revenue and no dividend, it’s usually a good sign that the company is cash strapped.

Another notable entry is Google Inc. (NASDAQ:GOOG) – the shorts are selling both A and C class shares alike.  Perhaps the recent stock split was a desperate move to keep the shares afloat in a deflationary advertising budget environment?  The amount of insider selling at Google would seem to indicate as much.

Top 15 Outstanding Short Positions as of 4/17:

https://wit1.interactivebrokers.com/images/insights/1958/losp042114.jpg


IB’s posts can be found here.

Long this short squeeze candidate

4/17/2014 – Long CCIH

We performed an algorithmic scan of 1700+ stocks overnight and some interesting patterns in the market are emerging.

The Algorithm picked up a Buy signal on Chinese internet company ChinaCache (NASD:CCIH) which is a content delivery network, which has negative revenue but could be ripe for a short squeeze with outstanding shorts representing 5% of the float and 44% institutional ownership.

Due to the high reward/risk nature of this trade we are adding this to our separate ‘Aggressive’ tracker (formerly the small cap tracker) which can be found here, as well as under the ‘My Account’ menu on the home page.

CCIH Daily

Top 5 Shorted Securities by Sector (IB)

Interactive Brokers – popular among the ‘smart money’ crowd – released the top 5 shorted stocks by sector as of today (April 15) and the top 5 largest short positions (4/11).   It seems the energy sector is ripe for a correction like we called 2 days ago (April 13) with our “Short Big Oil” call.

Other notable entries:   Blackberry ($BBRY) which has unsuccessfully been trying to put in a base, and a number of high profile banks such as Citigroup ($C) which has been trading well below its 200 day moving average.

Top 5 Shorted Securities as of 4/15:

Top 5 shorted stocks by Sector (source: IB)

Top 5 Largest Short Positions as of 4/11:

Top 5 outstanding short positions by Sector (source: IB)

IB’s posts can be found here and here.

2 Trades to capture interim capital shifts

We discovered some interesting themes during our latest algorithmic scans on over 1,000 stocks, translating in to 2 trades which have been added to the trade tracker:

1)  Strong Sell signals on Oil Companies:  Last night we tweeted an observation that oil companies should be sold, and Oil should start to slide.   Oil futures did tumble in today’s session and according to our algorithm, further downside is expected.  WTI Crude oil current has a risk premium attached due to Russia/Ukraine tensions, however fundamentally there is no significant reason why crude should be trading at these levels.

The Algorithm picked up a strong Sell signal on Enerplus Corporation (NYSE:ERF) – this is the same company we signaled on March 24 for a 1.5% gain to the upside.    We like this Short trade for the following reasons:

a) The company has a relatively high Dividend (4%) but is also highly priced, trading at 52 week highs with a blow-off technical top.

b) Company is based in Canada, whose stock market has been inversely correlated to Canadian dollar strength.  Since further upside is expected in the Canadian dollar, this should be negative for the overall Canadian equity market, including this company.

c)  Natural Gas fading:   Nat gas as been trading in a range since spiking over the winter, with further downside expected as a result of seasonality bias (bull typically ends in April).   A good portion of this company’s revenues are from Nat gas production and are exposed to this possible shift in trend.

Enerplus (NYSE:ERF)

2) Defensive Rotation:   For the past week as the S&P 500 sold off, our Weighted Momentum indicator showed that the Basic Materials sector was getting a lift on both the up and down days.  These contain companies such as potash producers and miners which should fare well in an inflationary environment (as per our post How To Play A Sideways Market).  The immediate reaction during sell offs is to rotate into such defensive sectors, and we expect this to continue into May.

Compass Minerals (NYSE:CMP) has been on a strong upward trend this year and is currently trading in the middle of an up channel.  The algorithm will buy this at the open tomorrow, however buy-stop orders should be placed at yesterday’s high of 57.06 for confirmation of trend.  An alternative trade would be Rio Tinto (RIO), however the algorithm favours CMP over RIO.

Compass Minerals (NYSE:CMP)

A note about the sell-off in Momentum Stocks:

Market sentiment is clearly turning negative toward ‘growth’ stocks without earnings which have had tremendous gains in the past year.  Stocks such as YELP, TSLA, and FB, which have confounded short sellers in 2013,  have experienced double-digit drops in price just in the past 2 weeks.

The opportunities to short these stocks is tempting.  YELP for example is at the bottom of the totem pole on the Advertising dollars food chain, but they are not profitable at all and the market believes they deserve a $4 billion market capitalization.

Another company that caught out eye is LIVE – a Groupon clone.  This company is also not profitable and are only active in a few cities in America, but their valuation is 27 times their current share price.   This particular stock has dropped so much so fast that the exchange slapped a short sale restriction on the stock to prevent it from going to zero.

Given the numerous sell signals we’ve seen on the S&P 500 and in our universe of 3000 stocks, it is clear the short sellers are in control and they have plenty of ammunition in the form of naked short positions.    As tempting as it is to join the party, the conditions under which these stocks are being short will likely induce volatile swings back up to test recent levels as many of the shorts cover.  We are keeping and eye on these and include these in our algorithmic scans – once attractive opportunities present themselves we will add these to the higher risk trade tracker.


HFT reminiscent of Naked Short Selling in 2002

At some point in the early 2000’s, it was fashionable to manipulate stocks down by shorting them without borrowing them first.  The practice of Naked Short Selling wasn’t against the law per se, but stock manipulation was and still is.  Unfortunately, as is the case with precedent-based securities law, governing policies are reactive and therefore ripe for loophole exploitation.  It took some investigative work by Bloomberg and some very public, brazen manipulation of stock before governing bodies tightened up the rules.

Those rules to ban manipulative Naked Short Selling were introduced in 2008.   5 years later we are again hearing about manipulation in the form of High Frequency Trading (HFT).  High Frequency Traders using latency arbitrage techniques are now in the public spotlight and much of the debate is reminiscent of the Naked Short Selling complaints 10 years ago.   In fact, this Bloomberg special on Naked Short Selling could easily be re-purposed for an expose on HFT.

As Mike Schneider reports:  “While naked short selling is legal, manipulation of markets is not, and regardless of intent the effect of naked short selling can be the same – driving prices lower”.  Sounds a lot like HFT…

Bloomberg Special: ‘Phantom Shares’

Gold is getting the bounce we anticipated – what’s next?

On March 30 we warned to stay away from Gold (‘Right now, the best way to play Gold is to stay away‘).  At the time, Gold was trading at $1295 and subsequently dropped $30 to the $1375 range.

We also called for Gold to re-test $1300, and today it did just that.

Our original post outlined some very key factors that would make us go long Gold.  Here is an update on how those factors are playing out:

Continue reading

Right now, the best way to play Gold is to stay away

Summary:

  • Medium term algorithmic signals show a rebound:  Expect a re-test of $1300
  • Long term algorithmic signals say Sell
  • With no catalyst on the horizon to push Gold in either direction, it’s best to stick to the side lines

At Intellikon, we have no bias in any market.  We are not thrill seekers, and we only take short positions when the statistical probabilities favor it.  We also understand that market conditions are not always conducive to profits, and these are the are times when it is best to stand aside.

It is for these reasons why we are staying away from Gold in either direction… for now.  Here’s why:

Continue reading

How to play a sideways market

Navigating through this market can be a challenge

It has been a strange, choppy start to 2014 on the S&P 500.    After the 120 point emerging market sell-off in January, the index rebounded to hit new highs on March 7th, only to pull back to where we started in January.
Continue reading

S&P 500 Sell-off confirmation with historical patterns – avoid going long

We ran the algorithm on the S&P 500 cash index from January 2013.  The historical trading pattern it picked up provided a sell signal near the start of the sell-off on Thursday, March 13.   We would avoid taking positions in new longs until the selling pattern subsides, or the S&P trades above 1870.    Shorts should target the 180Day Weighted Moving Average to take profits.

In the chart below, Green arrows are buy signals, Orange arrows are Sells.  Green dashed lines are profitable trades.

S&P 500 Daily
(click for larger image)

ETF Trades to ride out the volatility

The start of a calendar year is a time for capital shifting.  Large funds lock in their profit for the previous year to juice their bonuses as well as paint a good picture on the year’s performance for their investors.   This January however is one of the most volatile months in recent memory as a number of demographic, geopolitical, and centralized planning themes create market chaos.

Indeed, the CBOE Volatility Index hasn’t been this high since June of last year, and at this point it is more profitable selling options contracts than to invest their underlying securities.

Emerging Markets currency problems appear to be the theme of the month, and a good part of the turbulence can be attributed to investors weighing in on the impact to Western markets.

For us, our algorithms work on statistical probabilities based on historical events, and when the correlations and historical patterns break down, the number one rule in pattern trading is to wait on the side lines.   As a result, we have been mostly in cash as markets continue to reconcile because, as that super computer in War Games once said, sometimes the only winning move is not to play.

The large fund reporting deadline is still 1 week away but we continue to monitor the feed as early reporters submit their 13F forms.  It is at that time when we will have the best investment picture for 2014.  Until then, the complete picture of what large funds are positioning for is somewhat incomplete.  Holdings for the third quarter of 2013 show large positions in Financials and Emerging Markets, but those sectors are down considerably in 2014.   For the 4th quarter, large funds are either going to double down on their positions, or like John Boehner, as if investors are going to call it a decade and go completely into defensive stocks and other assets such as corporate bonds.

Until we get the big picture next week there are some smaller scale fundamental themes we are tracking which we can capitalize on now with Exchange Traded Funds:

Continue reading

Trade Updates – 1/27/2014 – We’re UP 6.75% in 2 weeks while the S&P is down 3.2% in the same period

We’re up 6.7% in 2 weeks while the S&P was down 3.2% in the same period

So far our algorithmic trades are doing quite well, especially when compared to the major global sell-off in the past few days.   As of today we’re up 6.75% on our picks, this after being up as much as 10% as of Friday.  Not bad when you consider that the S&P index lost 3.2% in the same period.


Continue reading

Tanger Factory Outlet Centers (NYSE:SKT)

Symbol: SKT (NYSE)

Signal:  LONG – 1/15/2014

New LONG signal on SKT based on a profitable trading pattern going back to January 2013.  Vanguard has increased their existing position by .5 % as of 9/30.   This is a retail stock – a sector which has experienced high volatility since December based on weak Black Friday sales figures, however the algorithm is calling for further upside.

Supporting research:

http://video.cnbc.com/gallery/?video=3000235825&__source=yahoo|headline|quote|video|&par=yahoo

http://www.thestreet.com/story/12114484/1/jim-cramers-top-stock-picks-hd-dks-bby-save-skt.html?puc=yahoo&cm_ven=YAHOO

SKT Daily – click to enlarge

Omega Healthcare (NYSE:OHI)

Symbol: OHI (NYSE)

Signal:  LONG – 1/15/2014

New LONG signal on OHI based on a profitable trading pattern going back to January 2013.  Vanguard has increased their existing position by 2% as of 9/30.   Stock is about to break through a very long descending triangle formed since May of this year.

Supporting research:

http://www.thestreet.com/story/12254207/1/use-options-for-a-chance-to-buy-ohi-at-a-23-discount.html?puc=yahoo&cm_ven=YAHOO

http://seekingalpha.com/article/1870131-omega-healthcare-investors-the-realty-income-of-the-senior-care-market?source=yahoo

OHI Daily – click to enlarge

Xcel Energy (NYSE:XEL)

Symbol: XEL (NYSE)

Signal:  LONG – 1/15/2014

New LONG signal on XEL based on a profitable trading pattern going back to January 2013.  Vanguard increased their existing position by 1.85% as of 9/30.   Stock is about to break through a very long descending triangle formed since May of this year.

Supporting research:

http://www.usatoday.com/story/money/2014/01/06/heat-is-on-for-utility-companies-in-states-hit-by-cold-blast/4343149/

http://www.forbes.com/sites/kensilverstein/2013/12/06/energy-subsidies-fan-the-flames-but-all-sectors-share-in-the-federal-pie/?partner=yahootix


XEL Daily – click to enlarge

National Retail Properties (NYSE:NNN)

Symbol: NNN (NYSE)

Signal:  LONG – 1/15/2014

New LONG signal on NNN based on a quite profitable trading pattern going back to January 2013.  Vanguard increased their existing position by 2.3% as of 9/30.   A double-bottom from September, as well as a break through of the 180day WMA at $32.45 would make this a very bullish signal.  Hang on to your hats…

Supporting research:

http://seekingalpha.com/article/1941831-no-mud-pie-eating-contest-for-national-retail-properties?source=yahoo

http://www.fool.com/investing/general/2014/01/11/ranking-5-of-our-favorite-dividend-stocks.aspx

click to enlarge

Click image to enlarge

What to expect in 2014

At times it seems like being invested in today’s stock market is like playing a ‘scratch n win’ lottery ticket:   An investor might believe they are close to winning, when in reality the end result has been predetermined.

In 2012, the financial crisis of 2009 was still fresh in our minds.  The European crisis was just getting started, and markets were volatile.

In 2013, Europe stabilized.  Greece nearly collapsed and left the EU, but the market moved on (even under the new precedence of using bank depositor cash to save the country).  The U.S. Government even shut down for awhile, but the market played onward and upward.

If you were a short seller in 2012 and, especially 2013, you got your clock cleaned.  It didn’t matter that all the news and evidence and statistics supported your position, markets were going up with or without your approval.

10 or 15 years ago, the bears might have been right about the negative fundamentals and their effect on the market, but in today’s centrally-planned global economy it’s a different game.  So what has changed since then?Continue reading

3 very good reasons to move into cash, wait on the side lines

It happens…

All our trade decisions are based on three factors:  Probabilities, risk, and reward.  In terms of the overall market, at the start of December we started noticing cracks in the fundamentals that drive these factors, and after only 8 trading days into the month those cracks appear to be widening.

Here then, is our rationale to move into cash and wait on the side lines:

1.  S&P at All Time Highs

The fact that indexes are hitting all time highs is not bearish in itself, however indexes have been making new highs all year long, and in order for large funds to realize those gains to make the year end bonus, they are going to have to sell what they’re holding.   The best forecasts are calling for further gains in 2014, but markets rarely go straight up and it is likely that there will be some corrections along the way.

2.  Correlations and Patterns Breaking Down

We scan over 700 stocks daily to determine trading probabilities and overall market sentiment.  Occasionally we see patterns which historically have been profitable in the past, start to break down or even reverse – this usually happens in individual stocks, but occasionally it will happen across the universe of stocks we scan.   The last time we saw this happen was in October, when after we made the call to move to cash the S&P dropped 50 points in the next 5 days.  Last Monday, we noticed this happen again and tweeted the observation , and this morning Zerohedge posted an observation from Deutsche Bank which supports this thesis.

3.  Signs of Selling

Large funds who need get get out of a position typically sell into rallies so as not to negatively affect the stock’s price.  If you manage billions of dollars of other peoples’ money (or in the case of Norway or BlackRock – trillions), and need out of your position, the best way to execute is to take out smaller buy orders with your own sell orders over a period of time.  In theory, your trading will fly under the radar and will not alert the market to your actions.   Nanex, which analyzes such trading patterns, has observed this practice all week with ‘small lots’ being filled at a higher frequency than usual.

Given these reasons above, it’s a good idea to move into cash and wait for market conditions to be more favorable.  It’s not a Buyer’s market by any means.  It isn’t even a Seller’s market right now – it’s simply a time of year where large fund managers are going to enjoy their gains before the markets get a chance to wipe them out.

We will continue to scan individual stocks and post trades that match our 3 criteria, however we are taking existing positions off the table until markets again can resolve themselves.


China Mobile (NYSE:CHL)

Update: Dec. 11, 2013

Signal:  Continue Long – with caution

From SeekingAlpha.com yesterday:

China Mobile (CHL -1.5%) and China Unicom (CHU -1.4%) have been cut to Equal Weight by Barclays. BofA/Merrill tried to temper iPhone expectations for CHL earlier this morning.

In the chart below you can see that the Barclay’s downgrade happened just as CHL was approaching the middle of a long term upward regression channel.  In the past we have noticed that announcements such as this (both bearish and bullish) have happened at key support and resistance points in other securities, so the timing of this announcement is no surprise.   CHL has gapped down the past 2 days and is trading slightly below the algorithm’s entry point of $52.65.   Time will tell (either today or tomorrow) whether this is a corrective move down to re-test the lower end of the regression channel, or if the stock will break through for further declines.

We officially have CHL on probation right now and will sell instantly should the stock not recover.  For now, large buyers are stepping in at the current level and the long-term support channel is holding.


CHL Daily (click to enlarge)

Continue reading

Everest Re Group Ltd. (NYSE:RE)

Update: Dec. 10, 2013 –  bearish news is starting to come out

Signal:  Continue Short

This morning Seeking Alpha tipped us off to a bearish report by SNL Financial about lower projected renewal rates for insurance premiums.  As a result, RE was unable to break through the 20 day EMA, is down 1%  on the day and is looking to go lower.  Looking at the price action, it appears some large buyers were attempting to prop this up, possibly for the purpose of extending their window to get out.  Still watching this one closely since, even though there is plenty of down side, the trend is still officially ‘up’ so the down move might be considered corrective until a solid down trend  develops.

RE Daily – click to enlarge


Continue reading

Baidu, Inc. (NASDAQ:BIDU)

Update: Dec 9, 2013 3:45PM

Signal:  Continue Long (entry price = $158)

We hope you have been enjoying the 8.8% run on Baidu since the algorithmic buy signal on 11/26.     This is a relatively new algorithm we are working with that uses dynamic calculations on each bar and therefore does not print a proprietary indicator, but it has been right on the money for us so far including an intraday algo we have running on Facebook.

From the chart pattern it appears that BIDU wants to go higher from here.  It put in a new 52week high and is right in the middle of a strong upward regression channel it has formed since January.   The current stop loss is a ‘disaster hedge’ in case markets completely fail, so it would be wise to tighten the stop to $162.26 lock in profit in case something disastrous does happen..

But we don’t see that happening with BIDU anytime soon.  All China names are being bought this quarter and we’re seeing the same bullish algorithmic patterns in a lot of stocks, which goes to show you how distorted markets have become because last year you couldn’t give away Chinese company stock as everyone thought the whole country was going to blow up, but it didn’t and it put in a bottom, and now all of the really wealthy people who have benefited the most from QE need something else to put their money into so why not into a geo-sector that was so beaten down the only positive fundamental going for it was that it couldn’t go any lower?

We’ll ride this wave with BIDU and our current position with CH, but the portfolio is looking a little China heavy.  We continue to scan all sectors and all countries for additional opportunities, but as we quickly tweeted this morning, “A number of algorithmic patterns that have worked well since June seem to be breaking down across the board. Possible EOY market cycle shift” – this doesn’t mean there aren’t opportunities, it means that new ones will start showing up very soon.  Stay tuned…

BIDU – it wants to go higher

Continue reading

The most accurate Gold price indicator we have seen yet (and it’s been bearish for months)

Update Dec. 30, 2013:

The indicator finally broke through the key $8.00 level on a move of over 2%,even as the GLD and GDX (gold miner) ETFs had limited gains on the day.  It could be that large money is coming back into this market, thus driving up the price of the fund.  Could this be a bottom on Gold?  Look for a follow up post on this subject based on our quantitative analysis.

Update Dec. 20, 2013:

The indicator wasn’t able to break through the $8.00 barrier, and likewise, Gold experienced a massive slam-down to break down below $1,200 this week.  Still waiting for the indicator to turn before trading Gold at all.

Update: Dec. 18, 2013:

Gold had a very volatile afternoon after the FOMC announcement, putting in a trading range of $40 from high to low.

So where did our indicator settle after all the dust settled?  Up 2% (13 cents to $7.81, which is 19 cents shy of our $8.00 bullish line in the sand.  This should be an interesting week.


Dec. 8, 2013

In April of this year, we were approached by a elderly lady who asked us to help with an investment portfolio left to her by her late husband.

The portfolio peaked in 2011 when it was worth in excess of $100,000 with capital invested of approximately $83,000, but since then the value had declined to $28,000 – a final investment loss of $52,000.

If you guessed that the portfolio was mostly invested in Gold, you would be correct.

Continue reading

Short Waddell & Reed (NYSE:WDR)

The algorithm picked up a strong trading pattern on Waddell & Reed Financial Inc. – the same company apparently responsible for the flash crash of 2010…  and we say ‘apparently’ because this has since been debunked by none other than the high frequency crime scene forensic experts over at Nanex.

This pattern has proven more profit efficiency while long than short, but it seems the stock is quite extended.  It seems analysts gave up covering the company a while ago and there is no recent news catalysts, so perhaps it’s just a correction… we will see…

WDR 240min – click to enlarge

The “I’m Mad As Hell And I Can’t Take It Anymore” Trade

Update: Nov. 29, 2013:  Revisiting this trading pattern for Thanksgiving:   Today was a half trading day and markets continued to melt up… could Monday be the reversal that this setup predicts?


Nov. 11, 2013:  It’s a holiday Monday for most traders today, which reminded us of one of our favorite market psychology studies from Mark Fisher in his book The Logical Trader.

It goes something like this: Give traders 3 days away from the markets to think about how much money they are losing in their current trade, and they will get out of the position entirely on the next trading day.

Continue reading

Case Study: Is priceline.com a short?

Earlier this month we asked our subscribers to give us the symbol of a stock, ETF or Future contract they are watching and we would run it through the algorithm to see which signals come up.

Priceline.com (NASD:PCLN) was mentioned as a possible short candidate, to which we responded on 11/15:

We discussed PCLN this evening and ran it through the algorithm. It looks like a short, feels like a short, but definitely not a short… yet.

A number of traditional technical indicators however would seem to show that the stock is poised for a correction:

Continue reading

Wynn Resorts Ltd. (NASD:WYNN)

Update: Dec. 4 2013

Status: Stop Hit – FLAT

The stop loss on the WYNN short position was hit at 3:20 PM today.  Total loss was the percentage of the stop loss which was set at 3%.   Today is a POMO day and markets as a whole appear to have new legs.  As well, bullish news was released out of Macau today and all international gambling stocks are getting a lift.

Continue reading

Companhia Energetica de Minas Gerais (NYSE:CIG)

Update: 11/19 11:40AM  – STOP HIT – Flat Position

The CIG long was stopped out at our 3% risk price level of $8.37.   Heavy selling at the ask brought the stock down from the 20day EMA.  It may find support and put in a base before breaking out, and the proprietary indicator seems to support additional upside, however for the risk parameters of this portfolio we are neutral on CIG until a new signal is generated.

Continue reading

Closing all positions, moving to cash.. for now (UAL,AVP,PCG,XLF,FLWS,CVX,ADI up 2.5%)

This morning we closed all our open blog picks (6 longs and 1 short) and went neutral on the portfolio for a total gain of 2.5% since September 3, and an overall portfolio gain of +8% since July 30.  In contrast, if you were to buy and hold the S&P in the same period you’d have a loss of about -2% today.

The clear patterns we were seeing in the markets earlier are starting to change.  This is could simply be some large portfolio re-balancing, or it could be the start of a period of volatility due to government shutdown.    Either way we expect many other investors who are seeing the same things we are to take the same action and go to cash.   We do not expect a market crash by any means, but at some point when this volatility is over there will be some good names available at good prices so it’s best just to keep the powder dry.

We are therefore moving to cash until the current environment resolves itself.  During this time we will continue to perform algorithmic scans to identify any new patterns that might be emerging this season.    Brief  commentary on each of our closed positions is below:

Continue reading

Riding a tsunami wave of Gold selling (stopped out, break even)

At 7:00 AM this morning over 2,500 Gold futures contracts were sold into the market in a time span of a single second. We have seen volumes of this magnitude in Crude Oil, but not Gold.

Many would say that this is manipulation. Yes, we have read Harvey Organ and GATA and Zero Hedge even started following Ferguson’s blog when it first launched, so we are aware of the accusations from bulls and non-bulls alike. The explanations are certainly plausible, but our view of markets has always been agnostic: if ever we do see evidence of manipulation, our only real concern is how to profit from it.

Continue reading

Still long, but Gold needs to prove itself (raising stop)

1 week ago on September 23 we made a very bold call to go long Gold based on a new signal generated by our predictive algorithm.

At that time, Gold was bouncing along new 52 week lows trying to find a bottom, trading below its 200 day average, and the sentiment was overwhelmingly bearish… so who are we – some boutique algorithmic trading consulting firm north of the 45 – to go against the trend calling a Buy on one of the most heavily traded metals in the world?

Continue reading

IBM Corp. (NYSE:IBM)

— 10/17 – Signal:  EXIT:  +8.32% Profit

Our IBM short trade was right on the money.  The signal came at the top of the current down trend and 2 weeks before IBM announced dismal earnings after market close yesterday causing the stock to plummet 6% in after hours trading.


–9/26/2013

Symbol: IBM (NYSE)

Signal:  SHORT

New SHORT signal on IBM, which has reached the top of a large triangle on the daily time period.  We are noticing sell signals on a number of IT services companies, but this one was the strongest.  Profitable trading pattern goes back to 3/09/13.

Related analysis supporting position:

http://seekingalpha.com/article/1664972-ibm-continued-struggles-in-the-cloud

http://seekingalpha.com/article/1628672-is-warren-buffetts-favorite-ibm-really-underperforming


Click image to enlarge

Click image to enlarge

Closing Gold short (+5%) going long

This morning our Gold algorithm closed out its short position for 5% gain and went long at the open at $1,320. We notified everyone on the Gold email list in the morning and tweeted the signal in the afternoon.

We wouldn’t normally go long after such a large leg down (10% from the August 28 high) as we like to see price recover and put in a base, so some of us are cautious about buying at this point. We also like counting waves and fibs and other trade school techniques to confirm these black box signals, but all of that is baked into the historical patterns on price action, volume, and time. The patterns have been strong all year so we’re going to let the algorithm run on this one with a stop at $1,285. If it turns out to be right then we’ll package these signals into a Gold Price Predictor and publish it on the home page.

Continue reading

Calling the bottom on Gold

Earlier this week we posted and tweeted a warning to stay away from Gold. We did this in reaction to a strong historical pattern our computer algorithm identified which was rather sobering. Many investors know that the current trend in Gold is down, but the question is, how low will it go?

Much has been written about the fundamentals of Gold as an investment and we won’t re-hash it here, but the past year has shown a shift in these fundamentals and perceptions resulting in price volatility, confounding those still looking for a market bottom. This is where our algorithmic signals become a valuable tool in an investor’s arsenal.

Continue reading

Computer Contradicts Cramer? Long FLWS

We love Jim Cramer (seriously). We read his book ‘Getting Back To Even’ which was released just after the financial crisis, and we were amazed at how well he authored some good practical advice based on strategies that  larger funds use.  He even included a great chapter on stock options that went down like a spoon full of sugar… Jim Cramer really does look out for the small investor, and that’s gold.

Today we decided to have some fun and run the algorithm on some of his stock calls from last week.  We used the screener on thestreet.com and came up with just over 30 stocks in the universe.   Continue reading

C.R. Bard, Inc. (NYSE:BCR)

UPDATE: 11/6

SIGNAL: TRADE CLOSED

The algorithm closed its short trade with BCR for 1.24% profit, however the historical patterns appear to be morphing as large funds rebalance their portfolios.  Algorithm is now flat on BCR with no positions.

Continue reading

Warning: Steer Clear of Gold (for now)

The algorithm picked up a strong historical pattern on both the GLD ETF and Gold Futures (GC) contract, and the situation does not look good for either.  We will be monitoring the performance this week, and if the pattern plays out we will post it here on Friday.

More to come so stay tuned…

Algorithmic BUY signals on Avon (AVP), Financials ETF (XLF)

Our weekly scan of high-probability trading patterns has yielded two good signals on a pair of unrelated companies.  The patterns go  back to January 2013 and yielded a cumulative profit of 20% and 68% respectively.  We are adding these to our performance tracking sheet (as seen at after the charts) to demonstrate the effectiveness of the algorithm, which is the same one that has returned over 75% since May on Facebook alone as shown on our Facebook Stock Predictor page.Continue reading

Long United Airlines (NYSE:UAL)

We are quite liking this price/volume pattern our algorithm picked up on United Continental Holdings Inc. (UAL) which has shown positive returns since the start of this year (January 4), and our proprietary indicator shows this to be a relatively strong reversal to the upside.  We are now tracking this Buy signal generated on September 6th on our blog performance sheet below.

To get updates on these signals be sure to subscribe to our blog updates using the form on the right side of this page.

Continue reading

5 things we know about Blackberry (closing short)

Here are 5 things we know about Blackberry:

  1. Prospects for the company as a stand-alone entity appear to be bleak, with shrinking market share and increasingly irrelevant operating system.
  2. Company buy-out seems to be Blackberry’s only hope to turn around their fortunes.
  3. Out of 293 institutional shareholders, 142 decreased their positions while only 115 increased their positions for a difference of about 8million shares or 15%.
  4. We are seeing a large number of Canadian Institutional and Retail traders alike bullish on Blackberry stock, but less enthusiasm for the stock outside of Canada.
  5. The last time we saw this much Canadian enthusiasm for a fledgling former Canadian success story was Nortel Networks.

Continue reading

Closing ABT, UNH, DUK short trades, going flat

Our algorithm took profits on the ABT and DUK shorts signaled from our August 12 post for 7% and 9% gains respectively, and reversed course on UNH for a 0.5% loss.  Yesterday, the algo generated a buy signal on all three, however due to the dramatic collapse of ABT and DUK (=profit) we will wait for these to base and put in some realistic levels before going long again.


Closing out BBRY long.. going short

A relatively quick turnaround on the initial BBRY algorithmic buy signal:  The algorithm generated a long signal 2 days ago and suddenly went short this morning at the open as we notified our mailing list members immediately.  The average price for reversing the position was $10.16 for a loss on that last trade of $35.00 (0.39%), as per our tracking sheet below.  The algo is now short at $10.16.

It appears there is a fight between bears and bulls for the $10.00 handle, so some chop can be expected and the Market will decide where BBRY price goes from here.  Our algorithm works on probabilities, and right now it’s saying that based on past trading patterns, BBRY will weaken..  We’ve learned to listen to it over the years, but because this is a short call on a beaten down stock we are lowering our risk level on the trade which reduces the number of shares and thus the amount of capital that is exposed.

If you’d like to be notified of the next BBRY signal just send an email to our listbot at [email protected]

Continue reading

DUK collapses after our algorithm’s SELL signal.. is United Health and Abbott Labs next? (DUK, UNH, ABT)

The Intellikon proprietary computer trading algorithm continues to exceed our expectations.

Two weeks ago we posted some strong sell signals generated by the algorithm for Duke Energy (DUK), Abbot Labs (ABT), and United Health (UNH).   We shared these high-confidence signals free to the public as a demonstration of our technology.   Since then, each signal has been very accurate, as per our blog tracking spreadsheet:Continue reading

New algorithmic BUY signal on Blackberry BBRY

One of our analysts pulled an all-nighter last night and developed an algorithm on Blackberry (NASDAQ:BBRY – formerly Research In Motion) after picking up a clear trading pattern.   We’re really impressed with the algo’s accuracy and it generated a BUY signal yesterday.  We’re not really a fan of Blackberry (ever since they stopped producing the thumb wheel), but if there’s going to be a short squeeze in play then this algo should be able to call the upside.Continue reading

Tracking This Week: Abbott Laboratories(ABT), UnitedHealth Group (UNH), Duke Energy (DUK)

It seems July was the month to lock in profit for a lot of the stocks we scanned this week.  These three stood out as potential for further downside with high probability.  Performance of these picks are posted below.

Abbott Laboratories (NYSE:ABT) – SELL

Sell signal generated on 8/7/2013 – opening fill price was $36.06.


UnitedHealth Group Inc.
(NYSE:UNH) – SELL

Sell signal generated on 7/30/2013 – opening fill price was $72.87.

Duke Energy Corp (NYSE:DUK) – SELL

Sell signal generated on 7/30/2013 – opening fill price was $71.40.


Subscribers: Algorithmic Trading Signals

This section is reserved exclusively for subscribers of the
Intellikon Algorithmic Trade Signal service

Subscribe
for access to algorithmic signals that generated Error
Google Apps Script
Authorization is required to perform that action.
% Gains Since Sept. 2013