Update Dec. 30, 2013:
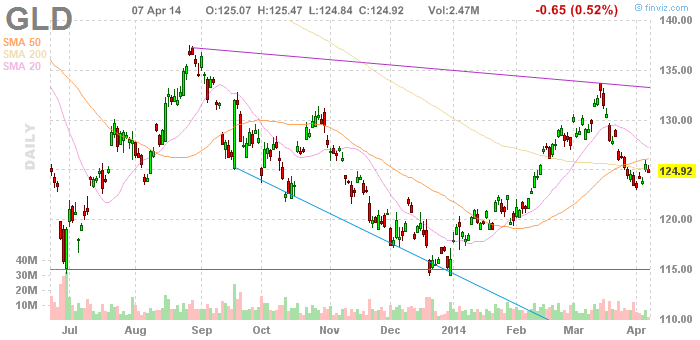
The indicator finally broke through the key $8.00 level on a move of over 2%,even as the GLD and GDX (gold miner) ETFs had limited gains on the day. It could be that large money is coming back into this market, thus driving up the price of the fund. Could this be a bottom on Gold? Look for a follow up post on this subject based on our quantitative analysis.
Update Dec. 20, 2013:
The indicator wasn’t able to break through the $8.00 barrier, and likewise, Gold experienced a massive slam-down to break down below $1,200 this week. Still waiting for the indicator to turn before trading Gold at all.
Update: Dec. 18, 2013:
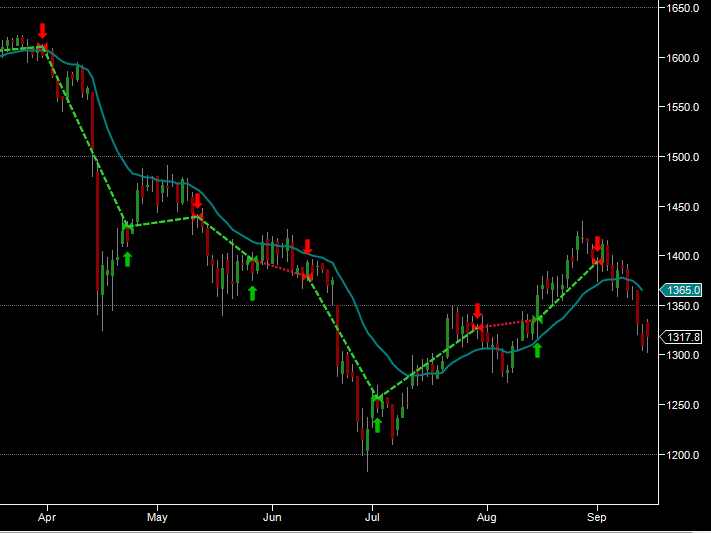
Gold had a very volatile afternoon after the FOMC announcement, putting in a trading range of $40 from high to low.
So where did our indicator settle after all the dust settled? Up 2% (13 cents to $7.81, which is 19 cents shy of our $8.00 bullish line in the sand. This should be an interesting week.
Dec. 8, 2013
In April of this year, we were approached by a elderly lady who asked us to help with an investment portfolio left to her by her late husband.
The portfolio peaked in 2011 when it was worth in excess of $100,000 with capital invested of approximately $83,000, but since then the value had declined to $28,000 – a final investment loss of $52,000.
If you guessed that the portfolio was mostly invested in Gold, you would be correct.
Continue reading→