This is a screen shot (click for full image) of our trading screen showing a very simple regression channel with a few standard deviations (10 min line-break bars) which has defined Facebook’s upward trend since August. This channel was officially broken yesterday morning (11/25) which, not withstanding a retest of the $46-47 range, should indicate further declines from here. This is how we would make a human-based decision based on probabilities, but our Facebook Stock Predictor algorithm is typically more accurate than us and ultimately makes the final call.
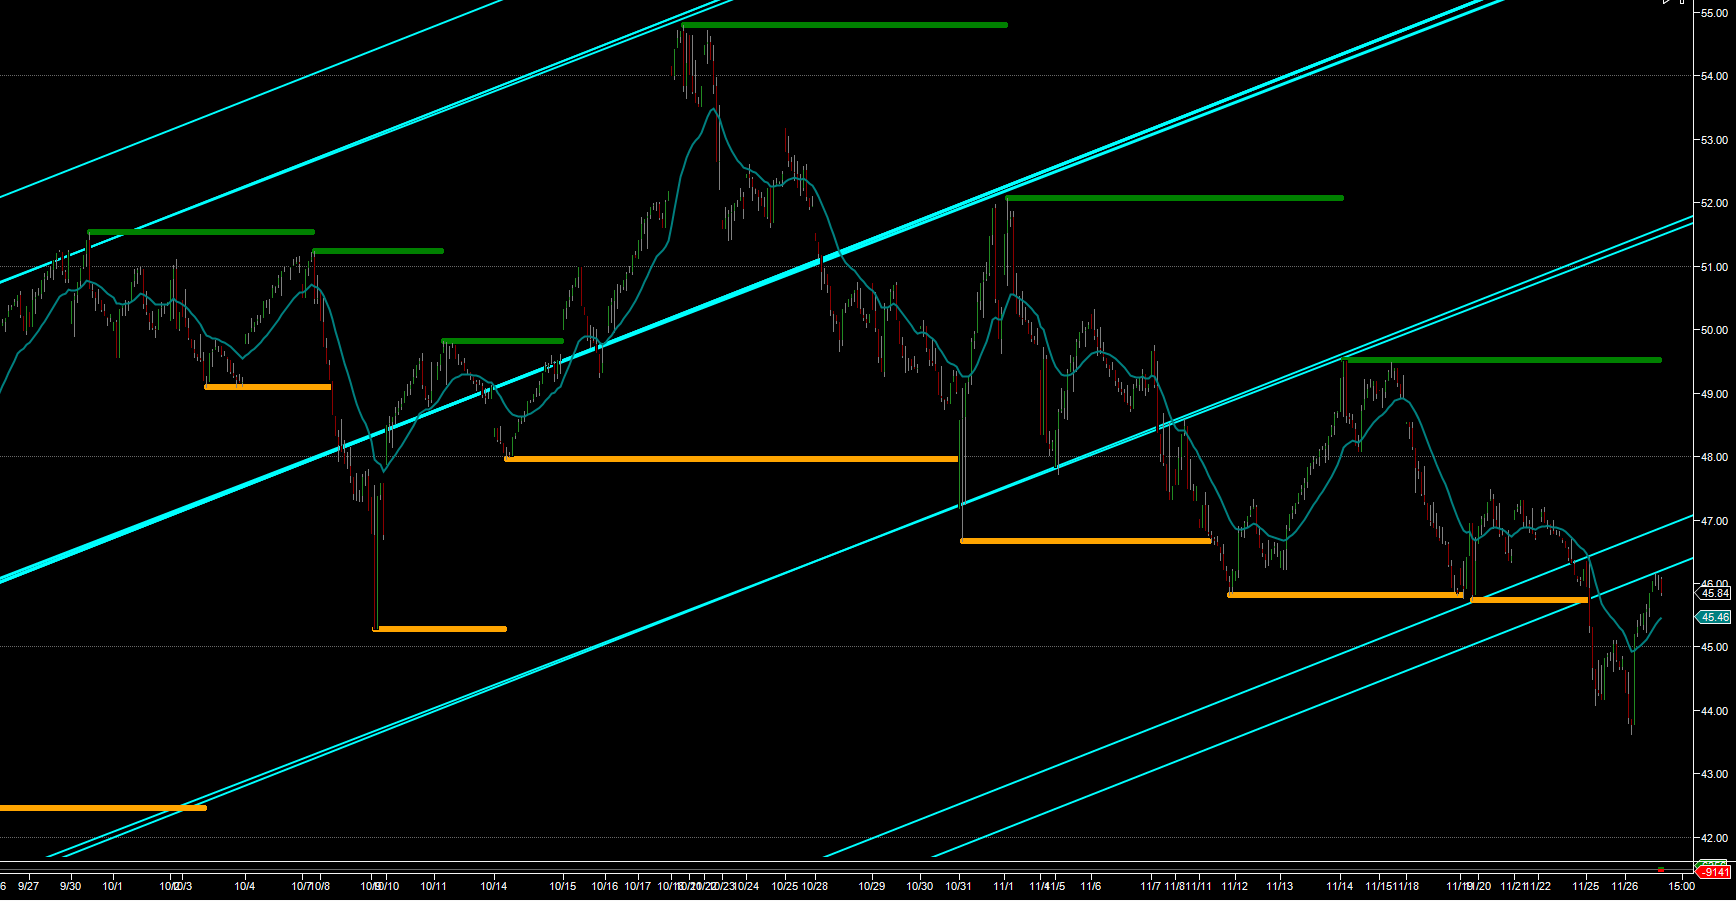
FB 10 min linebreak chart – clear regression channel dating back to August has been broken (click for larger image)