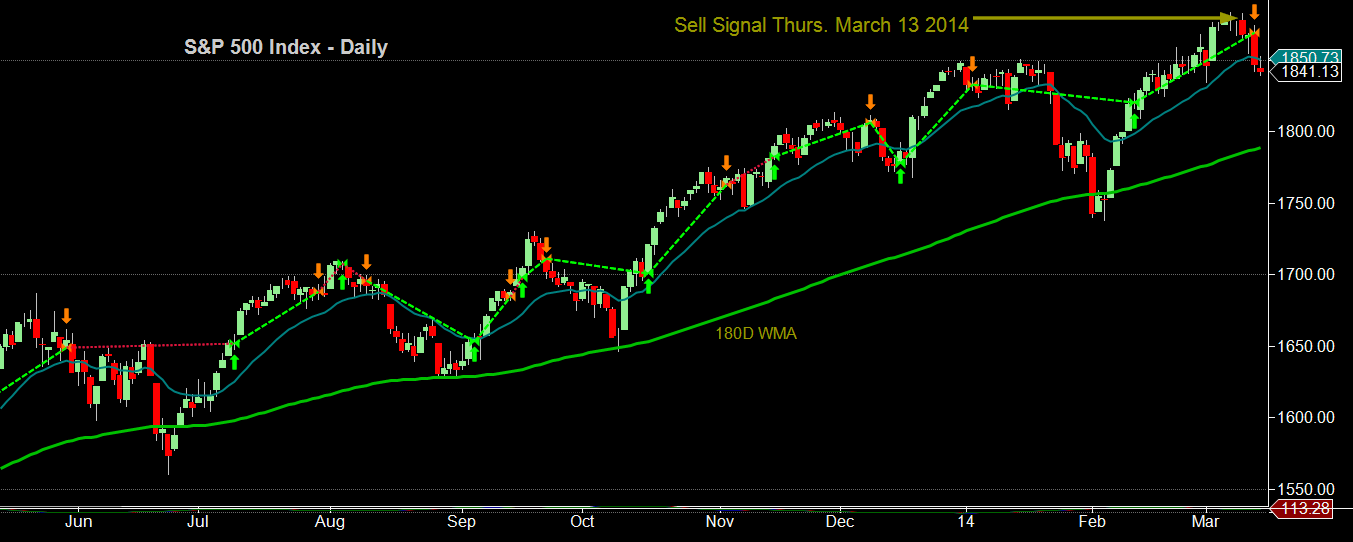
- S&P 500 shows strong upward momentum.
- Expect sideways trading action with occasional up/down extremes from now until September.
- Come Fall, expect news out of Asia and EMEA to give markets a downward Jolt.
Have you ever noticed that the largest market-moving news headlines happen between September and May? Russia/Ukraine, Abenomics, the European crisis of 2012… it is no coincidence that news with the greatest impact occurrs outside of Summer vacation season.
Market trends happen based on large capital flows, but capital only flows when the keepers of that capital are engaged. In the Summer, investors, politicians, and military leaders are more concerned with planning family vacations, enjoying the weather, and locking in gains they earned over the winter months. Even the President of the United States is on a working vacation this summer touring Europe with his family.
With fewer players at the poker table what we end up with is a wild game of 5 card stud that produce swings and sideways trading which can last for months.. at least until the kids are back at school.
